반응형
AWS EC2에 간다한 모니터링을 구축해보자!
1. InfluxDB
1.1 Yum Repository에 influxdb.repo 추가
cat <<EOF | sudo tee /etc/yum.repos.d/influxdb.repo
[influxdb]
name = InfluxDB Repository - RHEL \$releasever
baseurl = https://repos.influxdata.com/rhel/\7/\$basearch/stable
enabled = 1
gpgcheck = 1
gpgkey = https://repos.influxdata.com/influxdb.key
EOF
Influxdata 에서 제공할 때는 원래 baseurl = https://repos.influxdata.com/rhel/\$releasever/\$basearch/stable 이다.
하지만... Amazon Linux2 AMI는 releasever=lastest로 설정되어있기 때문에 잘못된 URL을 참조하면서 404 오류가 발생한다. 따라서 필자의 경우 $releasever를 7로 바꾸었다.
1.2 Repository 추가 확인
yum repolist
1.3 설치 및 구동
yum install influxdb         # 설치
systemctl start influxdb     # 구동
systemctl enable influxdb     # 활성화(부팅시 자동으로 구동이 되도록)
2. Telegraf
2.1 설치 (Telegraf는 influxdb.repo를 통해 설치할 수 있다.)
yum install telegraf 2.2 telegraf.conf 수정 (/etc/telegraf/telegraf.conf)
[global_tags]

# Configuration for telegraf agent
[agent]
    interval = "10s"
    debug = false
    hostname = "server-hostname"
    round_interval = true
    flush_interval = "10s"
    flush_jitter = "0s"
    collection_jitter = "0s"
    metric_batch_size = 1000
    metric_buffer_limit = 10000
    quiet = false
    logfile = ""
    omit_hostname = false

###############################################################################
#                                  OUTPUTS                                    #
###############################################################################

[[outputs.influxdb]]
    urls = ["http://localhost:8086"] # InfluxDB가 설치된 서버의 IP를
    database = "telegraf" # 데이터바에스 이름, 생성이 되어있지 않으면 자동 생성됨
    timeout = "5s"
    username = "admin" # InfluxDB 기본 계정
    password = "admin"
    retention_policy = ""

###############################################################################
#                                  INPUTS                                     #
###############################################################################

[[inputs.cpu]]
    percpu = true
    totalcpu = true
    collect_cpu_time = false
    report_active = false
[[inputs.disk]]
    ignore_fs = ["tmpfs", "devtmpfs", "devfs", "iso9660", "overlay", "aufs", "squashfs"]
[[inputs.io]]
[[inputs.mem]]
[[inputs.net]]
[[inputs.system]]
[[inputs.swap]]
[[inputs.netstat]]
[[inputs.processes]]
[[inputs.kernel]]- agent : 수집 및 전송 주기 설정
- outputs : 수집된 데이터를 어디로 보낼지 설정
- inputs : 수집할 항목 설정
2.3 구동
systemctl start telegraf
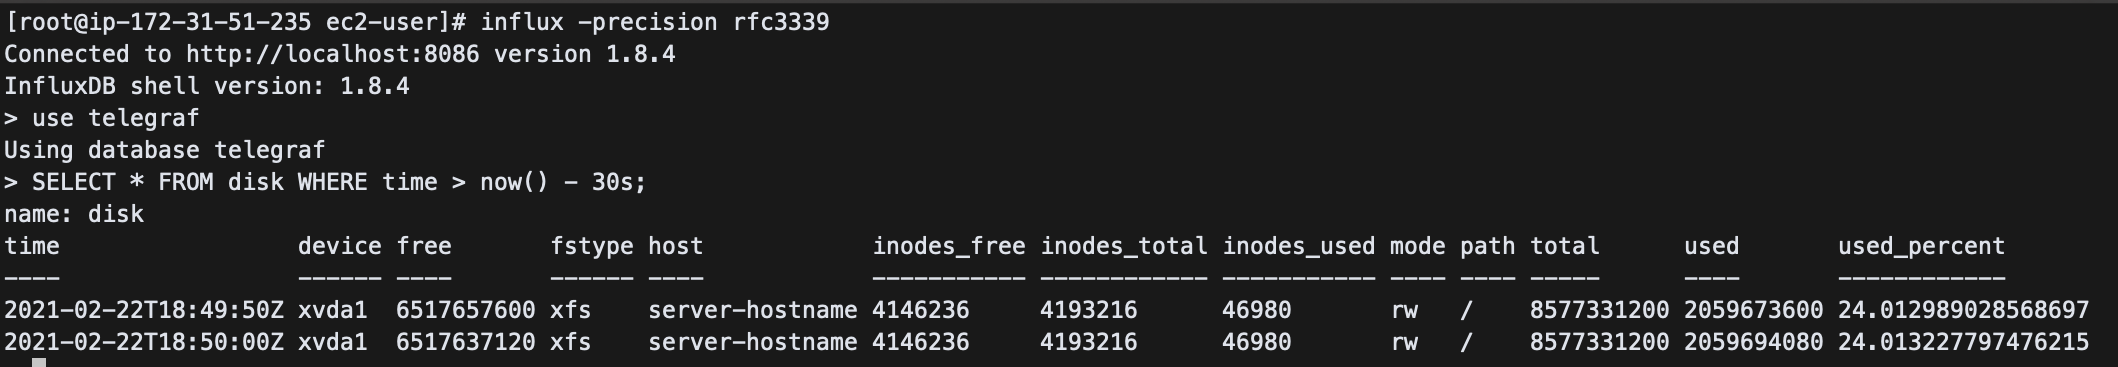
systemctl enable telegraf2.4 작동 확인
3. Grafana
3.1 Yum Repository에 grafana.repo 추가
cat <<EOF | sudo tee /etc/yum.repos.d/grafana.repo
[grafana]
name=grafana
baseurl=https://packages.grafana.com/oss/rpm
repo_gpgcheck=1
enabled=1
gpgcheck=1
gpgkey=https://packages.grafana.com/gpg.key
sslverify=1
sslcacert=/etc/pki/tls/certs/ca-bundle.crt
EOF
3.2 Repository 추가 확인

3.3 설치 및 구동
yum install grafana # 설치
systemctl start grafana-server # 구동
systemctl enable grafana-server # 활성화(부팅시 자동으로 구동이 되도록)
3.4 대시보드
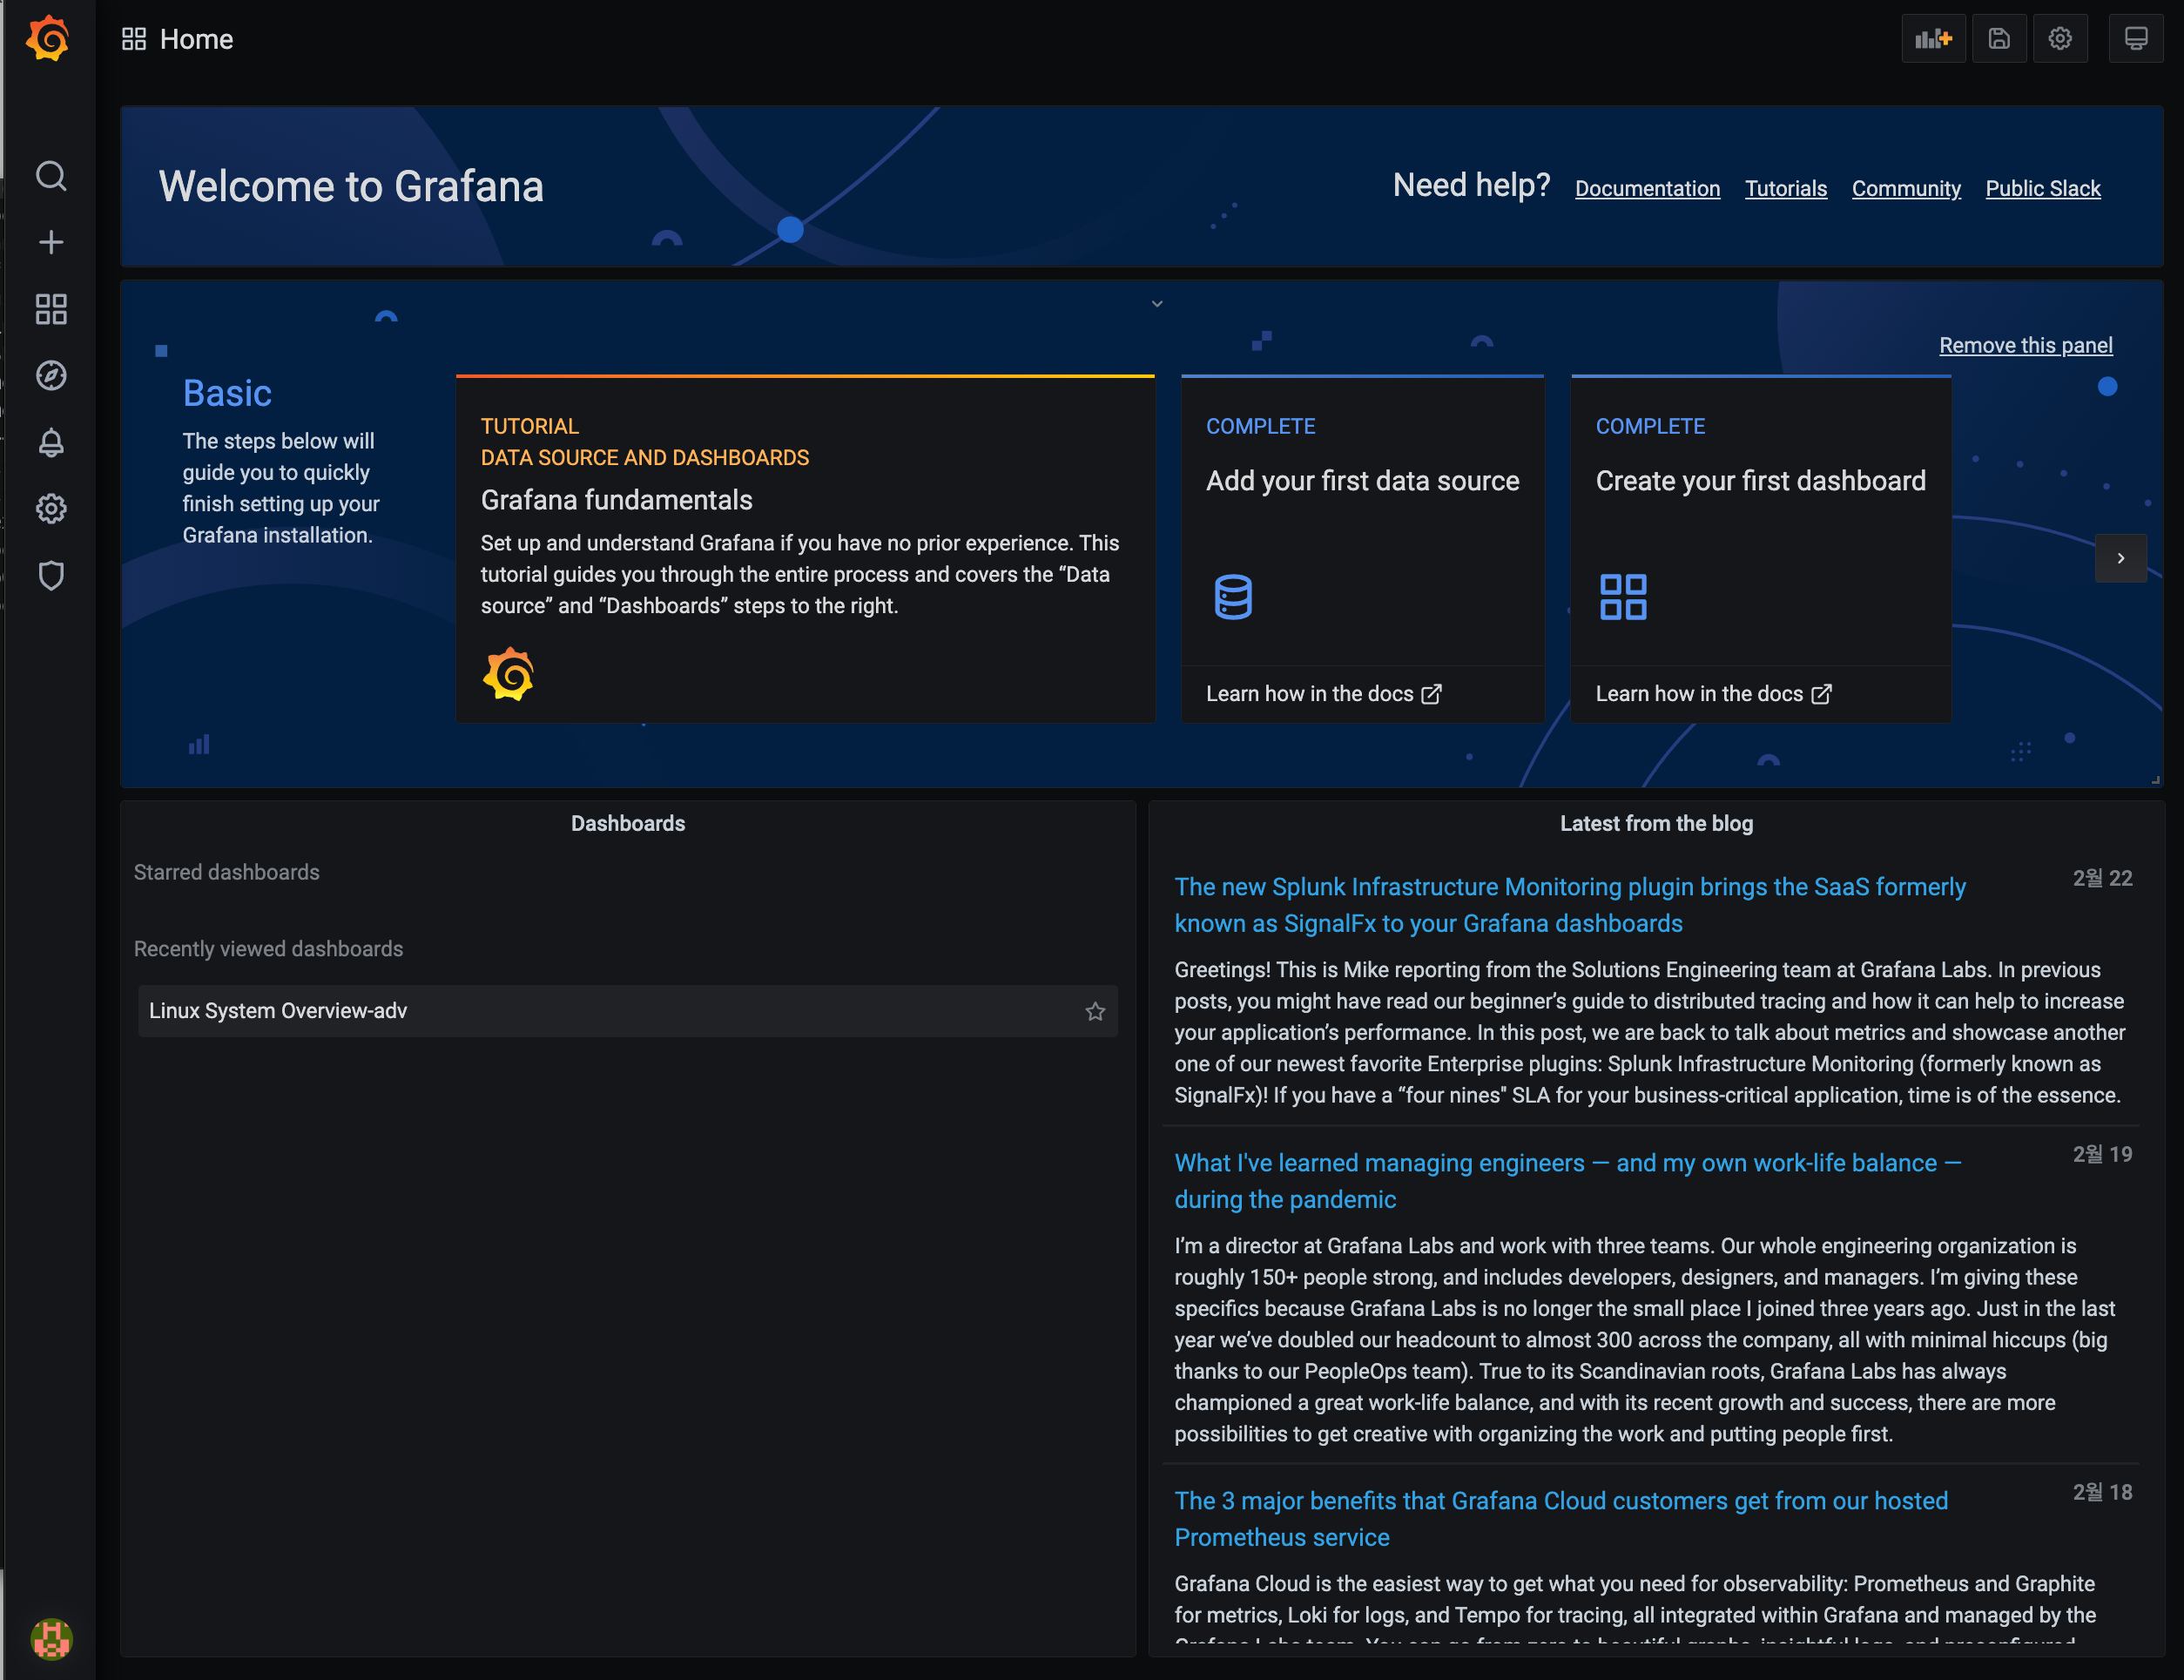
grafana는 3000포트를 사용하므로 "IP:3000" 에 접속한다.
- https://localhost:3000
- 기본 계정 admin / admin
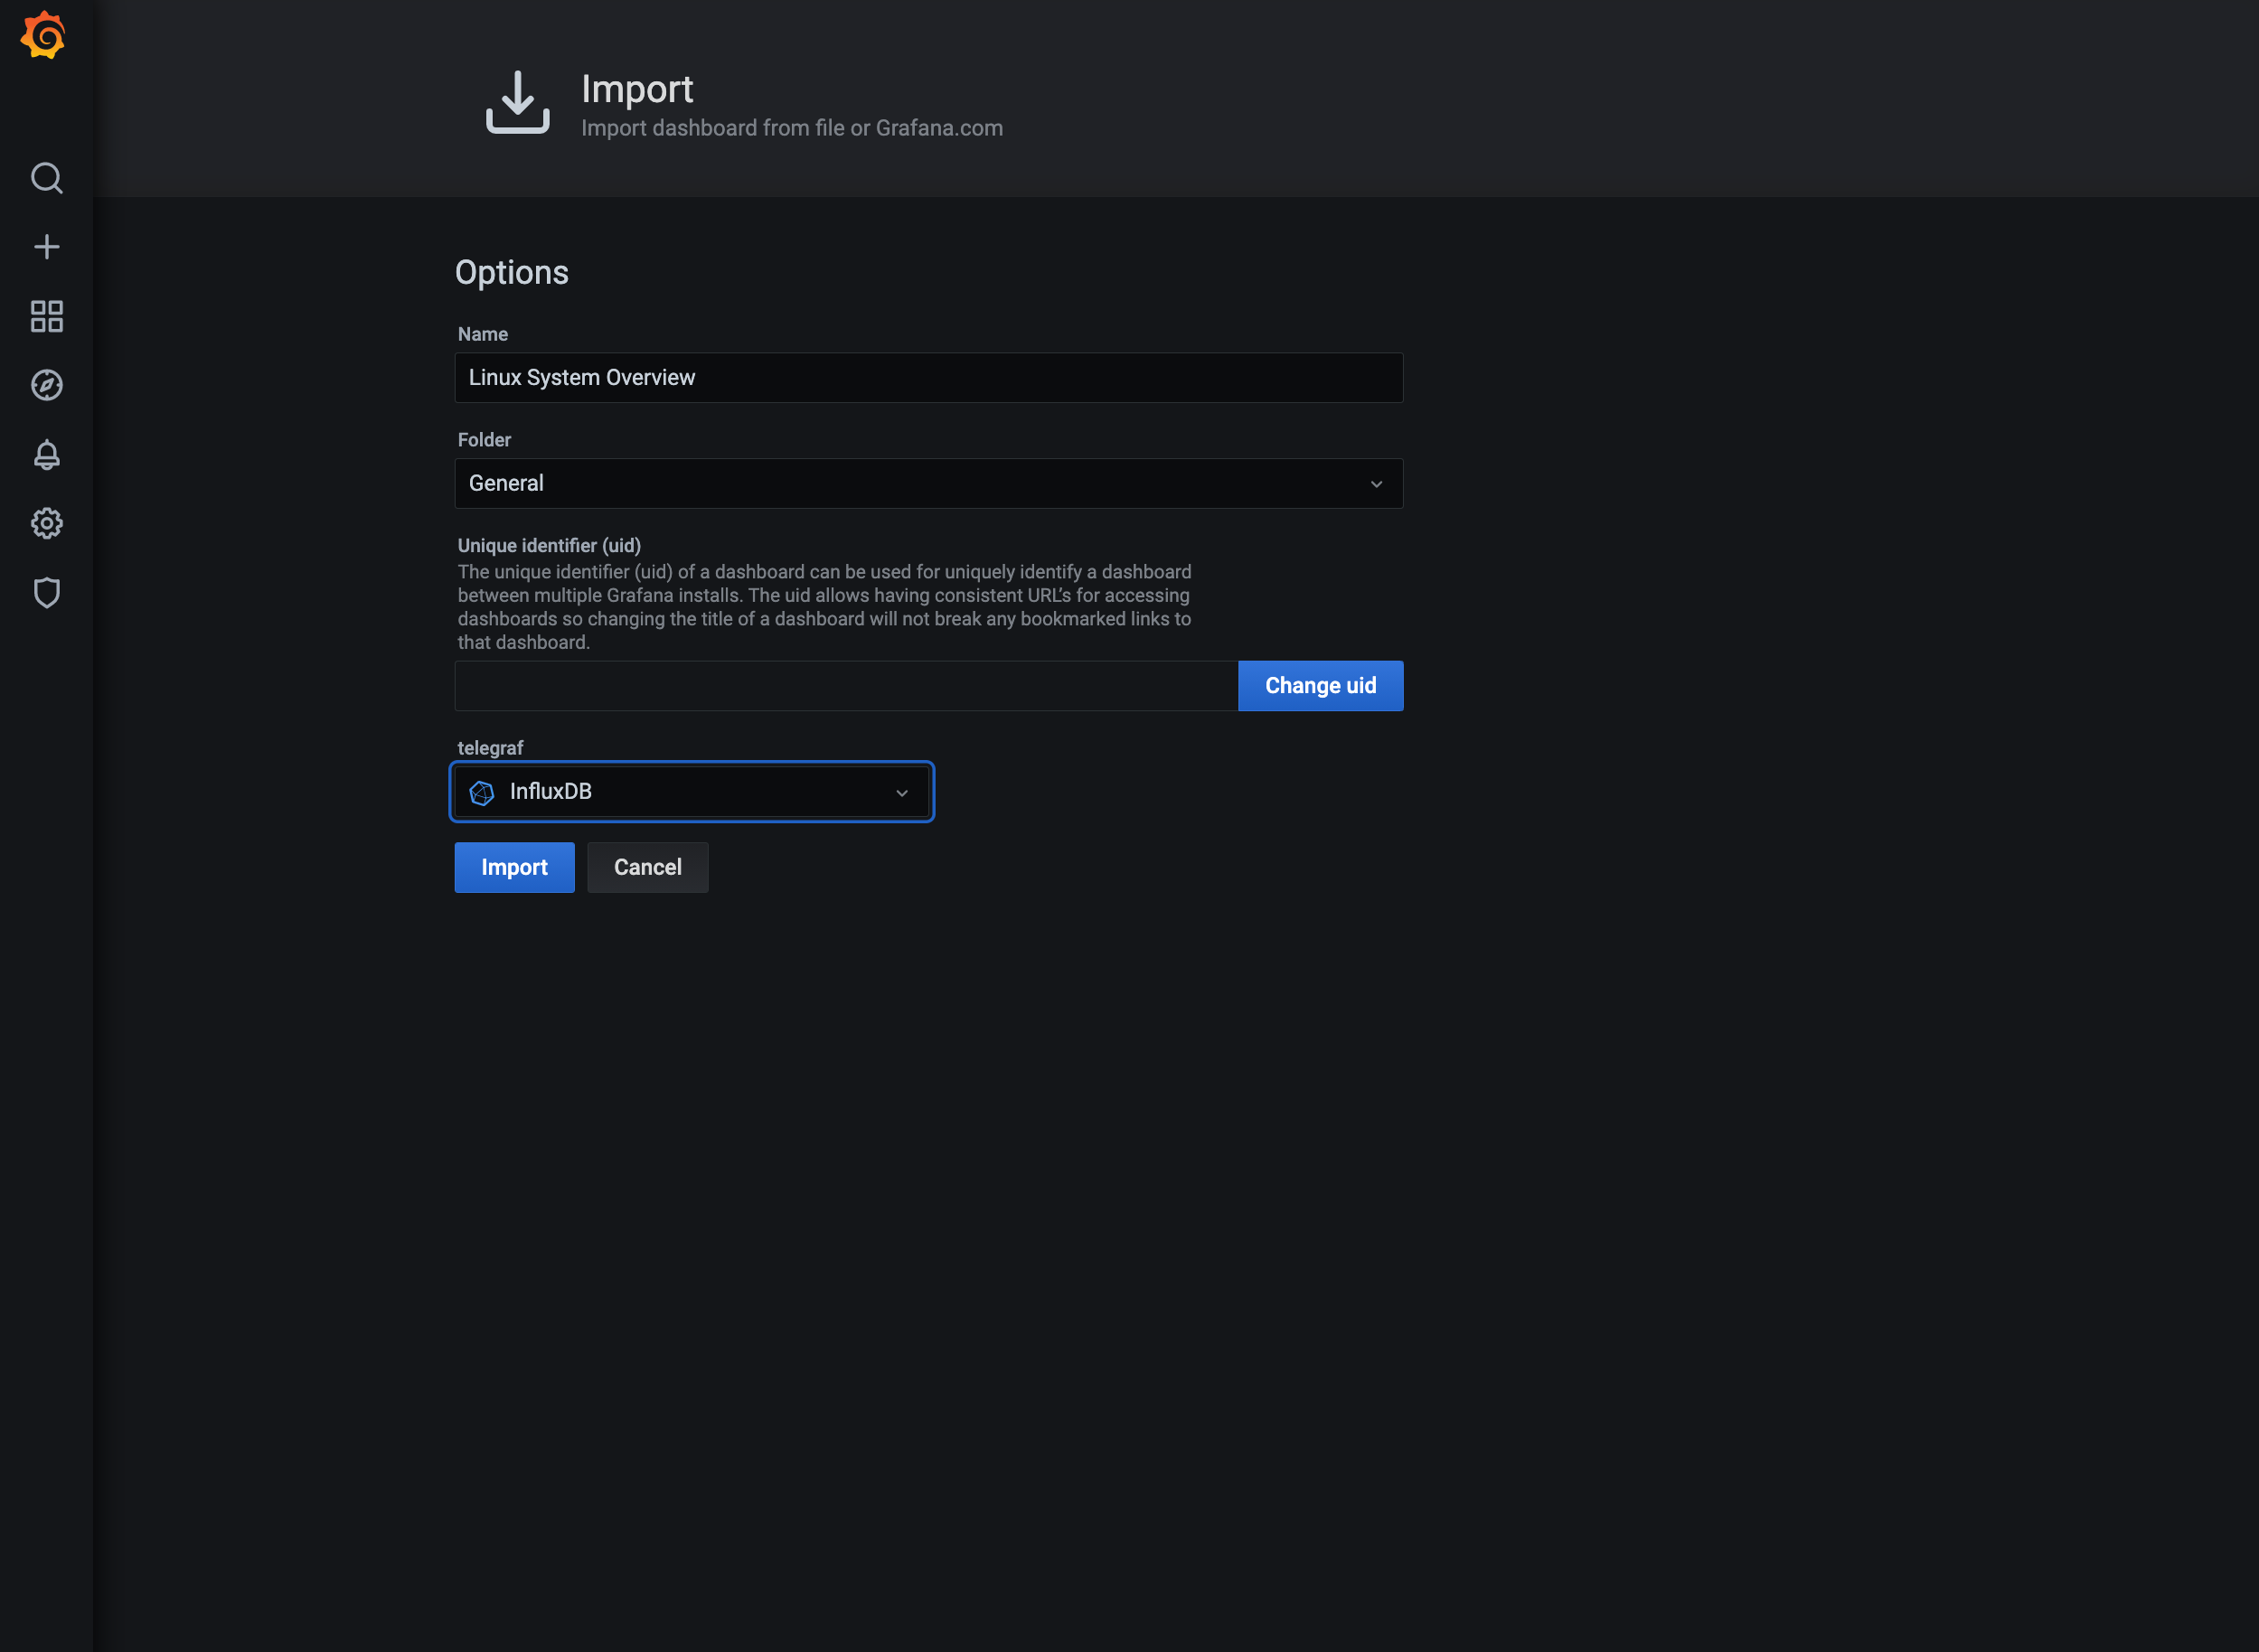
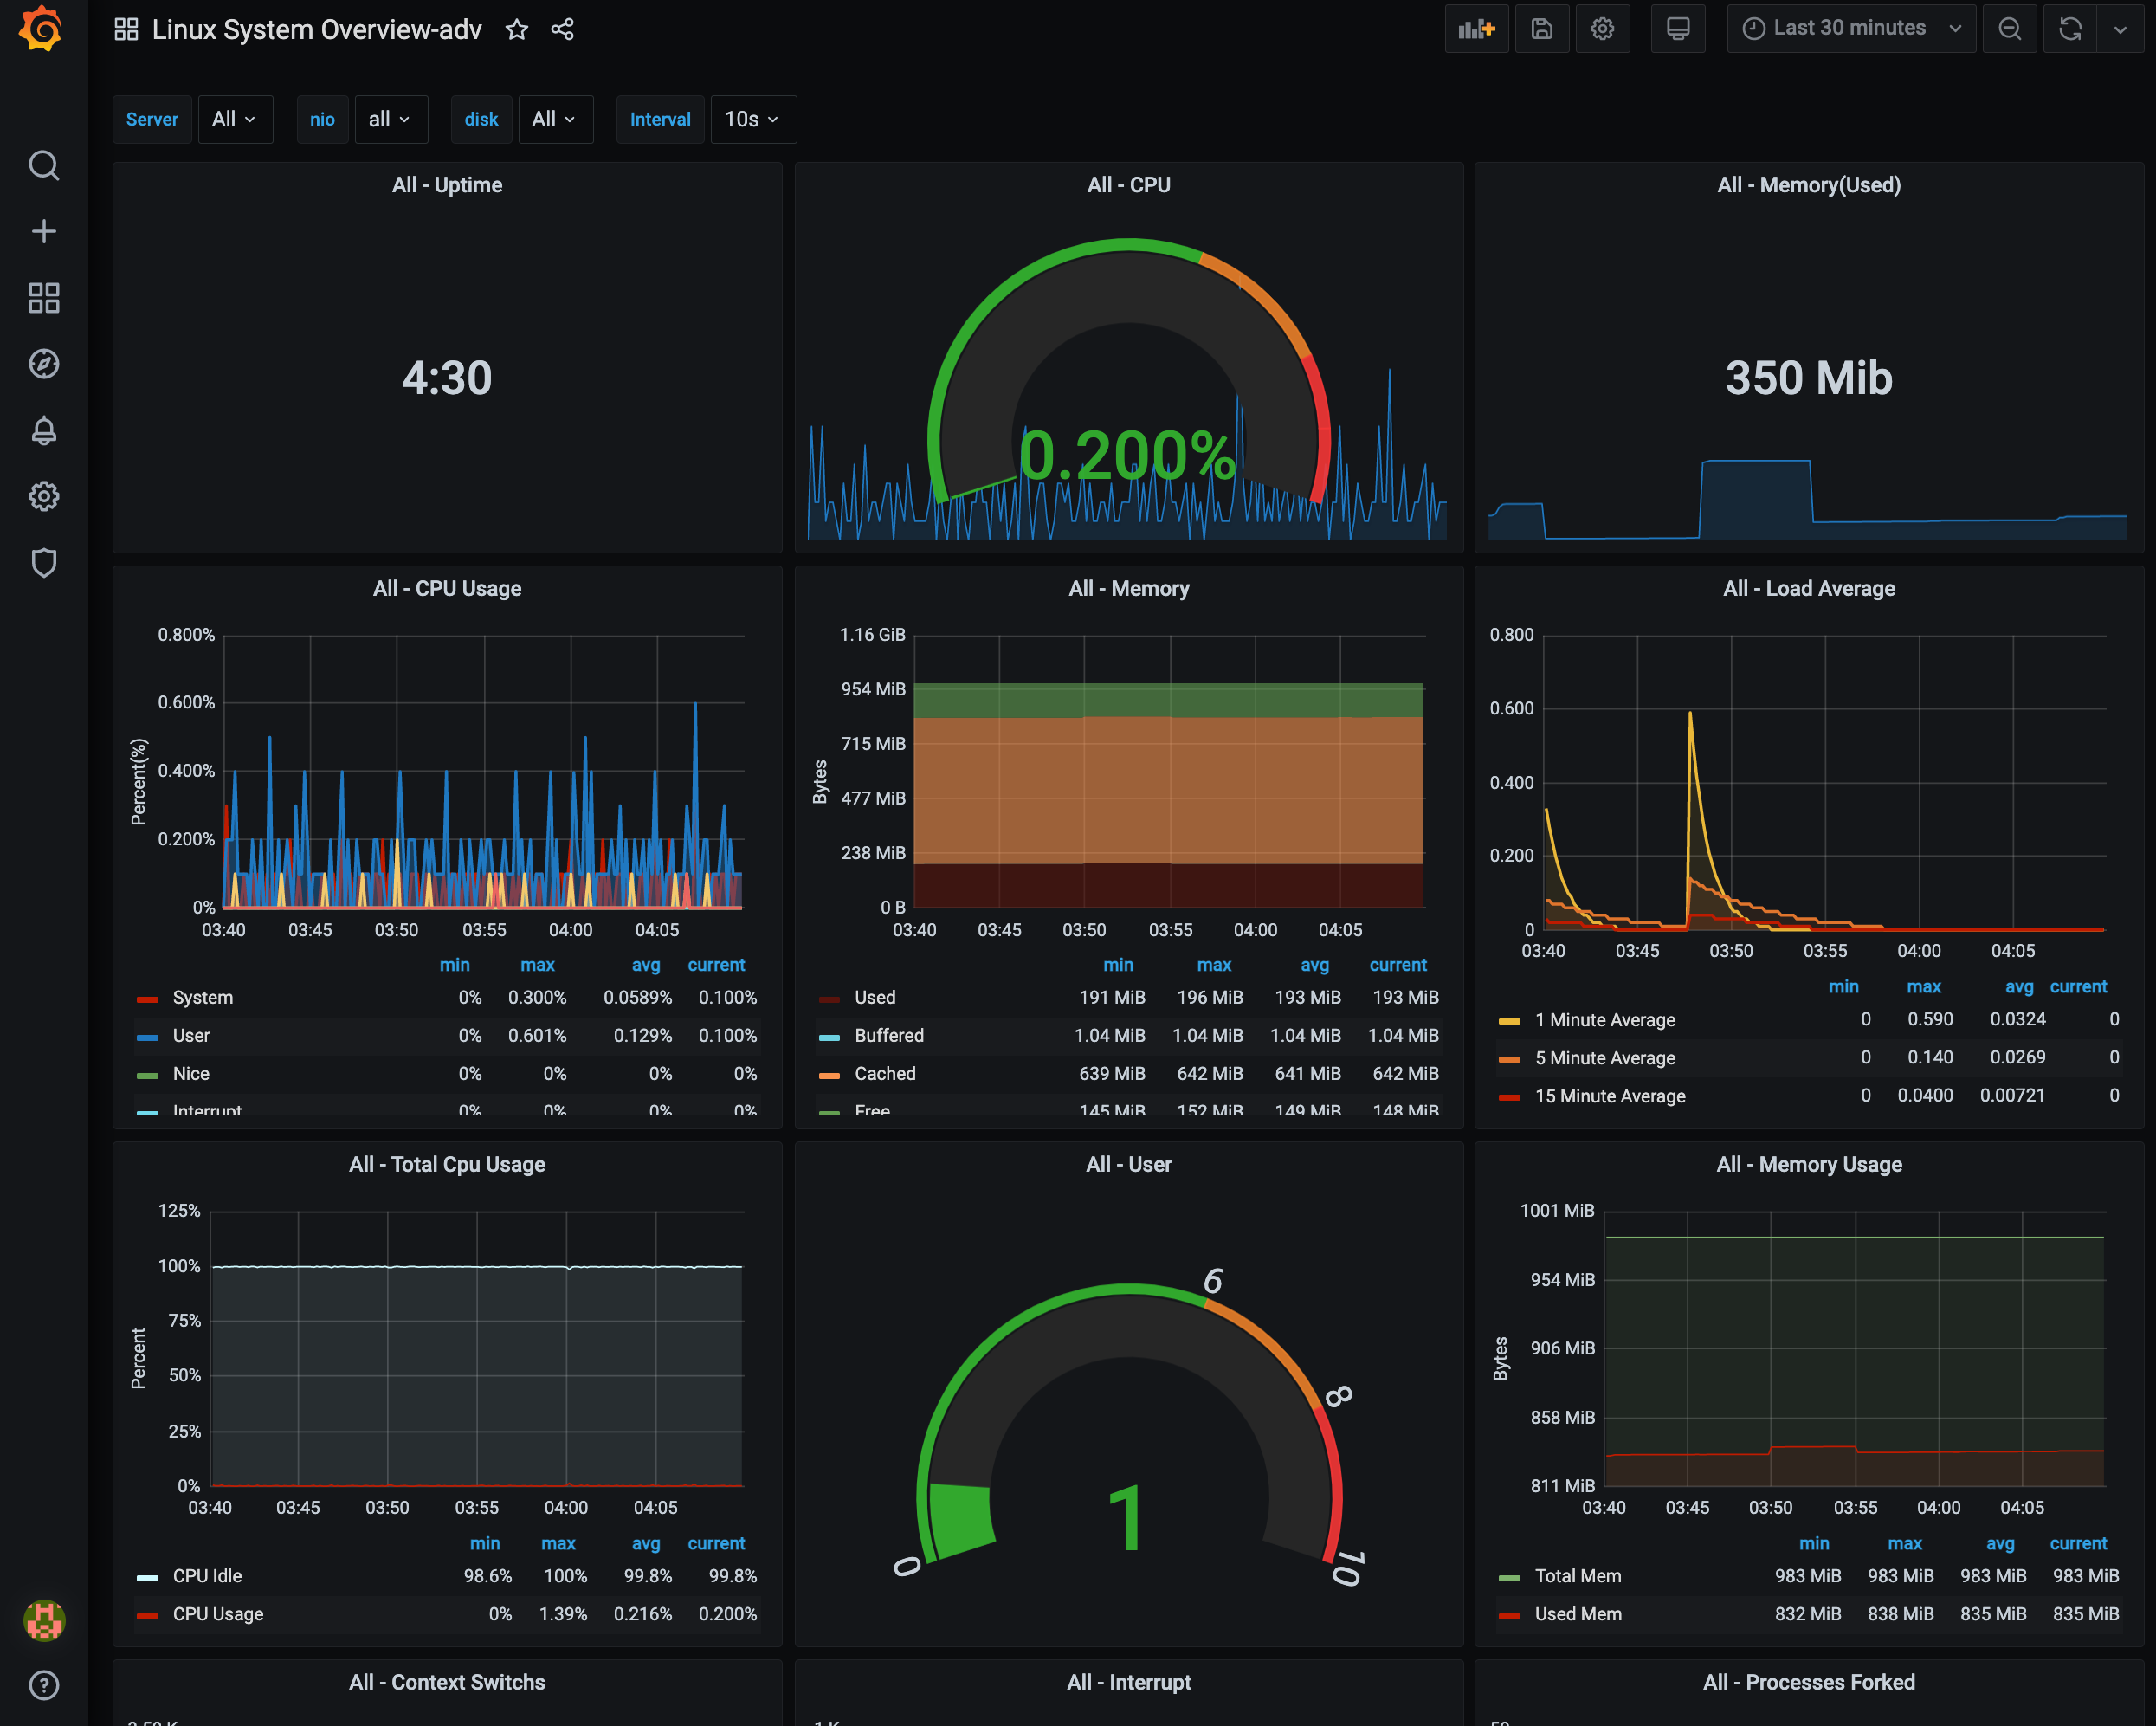
간단히 기존의 그래프를 불러오는 import를 통해 모니터링을 해보자.
https://grafana.com/dashboards/ 여기서 다양한 그래프를 얻을 수 있다. 필자의 예제는 https://grafana.com/grafana/dashboards/2381 를 참고하였다.

References
🏋🏻 개인적으로 공부한 내용을 기록하고 있습니다.
잘못된 부분이 있다면 과감하게 지적해주세요!! 🏋
반응형
'Monitoring' 카테고리의 다른 글
| [모니터링] 'Elatic Stack'을 이용한 서울시 지하철 대시보드 (0) | 2021.11.23 |
|---|
댓글